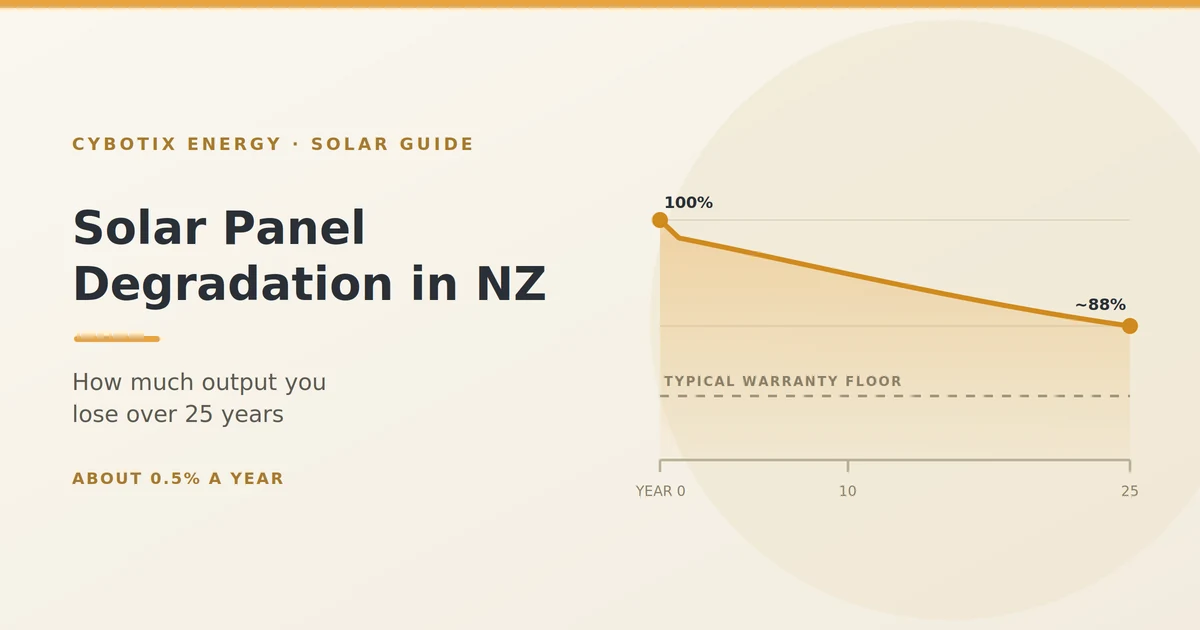
You’re being asked to spend five figures on equipment that everyone quietly admits gets weaker every year. Nobody in the sales conversation leads with that. So here’s the number: solar panel degradation in New Zealand runs at roughly half a percent a year, which puts a good panel at about 88% of its original output after 25 years.
Solar Panel Degradation in NZ
That’s the whole answer. What’s worth the next ten minutes is the spread around it because the difference between a well-chosen panel and a cheap one is small in year three and substantial in year twenty and how to tell whether your existing system is degrading normally or has an actual fault.
The short answer: about 0.5% a year
Analysis of thousands of installed systems puts median degradation at around 0.5% per year for crystalline silicon panels, leaving roughly 88% of original output at year 25. Monocrystalline panels made after 2000 come in nearer 0.4%. Panel quality shifts this meaningfully in both directions.
Any honest payback calculation already accounts for this. Degradation isn’t a hidden cost it’s a modelled one.
Why panels lose output at all
Four things happen slowly to a panel sitting on a roof for decades:
- UV exposure gradually degrades the encapsulant and cell materials
- Thermal cycling heating every day, cooling every night stresses solder joints and seals
- Moisture ingress through seals that age
- Discolouration of the encapsulant, which lets slightly less light reach the cells each year
None of it is dramatic. It’s the same slow chemistry that fades paint and perishes rubber, happening to a device with no moving parts.
Year one is different
New panels lose a chunk of output almost immediately light-induced degradation typically costs 1–3% in the first year, most of it in the first hours of sun exposure.
That’s normal and expected, which is why performance warranties usually specify a lower guarantee for year one (often around 97–98%) before settling into a slow annual decline. If your first summer looks slightly below the brochure figure, this is usually why.
Degradation is not failure
Worth separating clearly, because the words get used interchangeably.
A panel losing half a percent a year is behaving exactly as designed. A panel or string dropping 20% in a season has a fault a cracked cell, water ingress, a failed bypass diode, or something entirely outside the panel. The diagnostic section below covers how to tell.
What the numbers look like over 25 years
| Panel tier | Annual rate | Output at year 10 | Output at year 25 | Year-25 output on a 6,500 kWh system | Verdict |
|---|---|---|---|---|---|
| Premium N-type (TOPCon, HJT) | 0.25–0.40% | ~96% | ~91–92% | ~5,950 kWh | Best long-term value |
| Standard monocrystalline | ~0.4–0.5% | ~95% | ~88% | ~5,720 kWh | The sensible default |
| Older polycrystalline | 0.7–0.8% | ~93% | ~83–84% | ~5,430 kWh | Being phased out |
| Budget tier-3 | 0.8–1.0% | ~91% | ~78–80% | ~5,100 kWh | False economy |
Figures are indicative and assume normal operating conditions.
Two things to take from that table.
The gap compounds. In year three, a premium panel and a budget panel differ by about one percent invisible on your bill. By year twenty-five the gap is over ten percent of everything the system produces, every year, for the rest of its life.
Panels are a minority of what you pay. The inverter, the mounting, the scaffolding, the electrical work, the labour and the compliance make up most of a solar installation’s cost. Saving a few hundred dollars on panels to buy a faster-degrading product is a poor trade, because you’re not saving a meaningful share of the total.
Does New Zealand’s climate make it better or worse?
Better, mostly and this is the part no global guide tells you.
Heat is the enemy of panel longevity. System-level degradation runs around 0.88% per year in hot climates against roughly 0.5% in temperate zones, and studies in desert and tropical regions have found rates between 1.2% and 1.8%.
New Zealand is temperate and maritime. Our panels simply don’t experience the sustained thermal load that drives those higher figures. If you see a scary degradation statistic online, check where the study was done before applying it to a roof in Tauranga.
The New Zealand catch: salt air
The thing that ages panels here isn’t heat it’s the sea.
Most New Zealand homes sit within a short distance of the coast, and salt-laden air attacks aluminium frames, mounting rails, fasteners and junction box seals long before the cells themselves become the problem. Corrosion at the frame or mounting level can cause water ingress, and that does cause real degradation.
If you’re within a few kilometres of the coast which covers a large share of the country ask specifically about salt-mist corrosion certification for both the panels and the mounting system. Stainless fixings matter as much as the panel brand.
High UV, moderate heat
New Zealand’s UV levels are high by international standards. That does age encapsulants over decades, but it’s sustained high cell temperature that drives the faster degradation seen in hot climates.
The combination here strong light, moderate temperatures is close to ideal. Strong light means good generation; moderate temperatures mean slower ageing and better panel efficiency, since panel output actually falls as cells get hotter.
Soiling, lichen and shade
These aren’t degradation, but they’re the most common cause of an output drop in New Zealand particularly in damp, sheltered or rural locations.
Dust, pollen, bird droppings, and in shaded damp spots actual lichen growth all reduce output. So does a tree that’s grown, a neighbour’s new build, or a TV aerial installed last year. Rain does a reasonable cleaning job on a tilted array, but not on a shallow-pitched one and not where growth has taken hold.
The important distinction: this is recoverable. Degradation isn’t.
How to tell if your panels are degrading or something’s wrong
Here’s the diagnostic path, which is the most useful thing on this page if you already own a system.
What normal looks like in your data
- Pull annual production figures from your inverter app or monitoring portal full years, not months.
- Compare like with like. This summer against last summer, this calendar year against the one before. Comparing March to June tells you nothing.
- Expect roughly 0.4–0.6% per year for a standard system in normal conditions.
- Allow for weather. A cloudy summer can easily swing annual production by more than degradation does in a decade.
A consistent decline of 1.5–2% or more per year is the point at which something else is going on and you should investigate.
Rule out the usual suspects first
In rough order of likelihood:
- Soiling. When were the panels last cleaned or properly rained on?
- New shade. A tree, a building, an aerial, a new chimney.
- Inverter trouble. Inverters fail far sooner than panels typically the first component to need replacing in a system’s life.
- A tripped or offline string. Part of the array not reporting at all, which looks like a gradual loss if you only check monthly totals.
- Monitoring error. A failed sensor or a mis-scaled dashboard.
Most of what gets reported as “my panels are degrading” turns out to be one of these five.
When to call someone
Book a service visit if you see a sudden step down rather than a gradual slope, if one string consistently underperforms its twin, if production drops and stays down after weather has recovered, or if you’re seeing 1.5%+ annual decline across several years of clean comparison.
Reading the warranty properly
This is where the money sits, and where sales conversations get vaguest.
A performance warranty typically guarantees around 97–98% of rated output in year one, then a declining figure to somewhere between 80% and 92% at year 25 depending on the tier. Premium tier-1 manufacturers now commonly offer 30-year performance warranties.
Three things to check in the wording.
Linear versus step warranties
A linear warranty guarantees a minimum output every year for example, 98% at year one, then no more than a set percentage of decline annually. A step warranty guarantees output at milestones only, such as 90% at year ten and 80% at year twenty-five.
Linear is materially better. Under a step warranty, a panel that degrades badly in year six may not breach anything until the year-ten milestone arrives.
Product warranty is not performance warranty
Two different documents, two different durations.
The product warranty covers manufacturing defects and physical failure often 12 to 25 years depending on the brand. The performance warranty covers output over time. A panel can be perfectly intact and still underperform its curve, and only one of those documents helps you.
Who honours it in 25 years?
The question almost nobody asks in a sales meeting.
A 25-year warranty is a promise from a manufacturer. Its value depends on that manufacturer still existing, and on someone in New Zealand handling the claim because shipping panels offshore for assessment is not a realistic homeowner exercise.
Two practical protections: buy from an established manufacturer with a long trading history and a local distribution presence, and buy from a New Zealand retailer, so the Consumer Guarantees Act gives you rights against a company you can actually reach. A grey import weakens both at once.
If you want to see how we handle warranty and support, that’s on our site at Cybotix Energy.
Do panels stop working at 25 years?
No. The 25-year figure is a commercial warranty period, not a physical lifespan.
Quality panels commonly keep working for 30 to 40 years, and panels installed in the 1980s and 1990s have been tested still producing above 80% of their original output after 35 to 40 years in the field.
What actually ends a system’s life is usually something else: the inverter needing replacement, a roof needing work, storm damage, or the owner deciding that newer panels in the same roof space would produce substantially more.
What this means for your payback maths
Degradation should already be in the numbers you were shown. A system modelled honestly assumes production declines slightly each year, and the payback figure accounts for it.
That gives you a useful test of any quote you receive. If the projected savings assume year-one output for twenty-five years, the quote is wrong and more importantly, it tells you something about how the rest of it was prepared.
Ask to see the declining production curve. Any installer who models it properly will be happy to show you.
FAQs
How much do solar panels degrade each year?
Around 0.5% per year for standard crystalline panels, with premium N-type products at 0.25–0.40% and budget panels at 0.8–1.0%. That puts a good panel near 88% of original output at year 25.
Do solar panels stop working after 25 years?
No. That’s a warranty period, not a lifespan. Quality panels often run 30–40 years, and panels from the 1980s and 90s have been measured still producing above 80% of original output.
Is my system underperforming or just degrading?
Compare full years, season for season. Normal is roughly 0.4–0.6% annual decline. A sudden step down, or a consistent 1.5%+ yearly drop, points to soiling, shading, a string fault or the inverter rather than the panels.
Does New Zealand weather damage solar panels?
Our temperate climate is favourable sustained heat is what accelerates degradation, and we don’t have much of it. The local risk is salt air near the coast, which attacks frames, fixings and seals rather than cells.
Are premium panels worth it for slower degradation?
Often, yes. The difference is negligible early on and over 10% of annual output by year 25. Since panels are a minority of total system cost, the saving from cheaper panels is small relative to what it costs you later.
What does a 25-year warranty actually guarantee?
Usually a minimum percentage of rated output at defined points, with a lower figure in year one. Check whether it’s linear or stepped, and check it separately from the product warranty, which covers defects rather than output.
Does salt air affect solar panels?
Yes, most commonly the frames, mounting hardware and junction box seals rather than the cells. If you’re near the coast, ask about salt-mist corrosion certification for both panels and mounting.
The bottom line
Expect about half a percent a year, and roughly 88% of original output at year 25 from a decent panel. New Zealand’s temperate climate puts us at the favourable end of the global range, with salt air rather than heat as the local risk to manage.
If you already own a system and think it’s fading, check soiling, shade and the inverter before you blame the panels that’s where the answer usually is. And if you’re buying, look at the degradation rate and the warranty structure, not just the price per watt. The panel is a small part of what you’re spending and a large part of what you’ll get back.